Ellen Gomes
GIS and environmental data
Python · remote sensing · forest data
M.Sc. Forest Information Technology
B.Sc. International Forest Ecosystem Management
GIS and environmental data
Python · remote sensing · forest data
M.Sc. Forest Information Technology
B.Sc. International Forest Ecosystem Management
I turn raw environmental data into maps and answers: from drone flights and LiDAR point clouds and hyperspectral satellite data to Python workflows on open government data. My focus is forests and ecosystems, and I work with Python, QGIS, ArcGIS, R and Google Earth Engine. The newest projects are at the top. Open a map to explore it, or click an image to see it in full size.
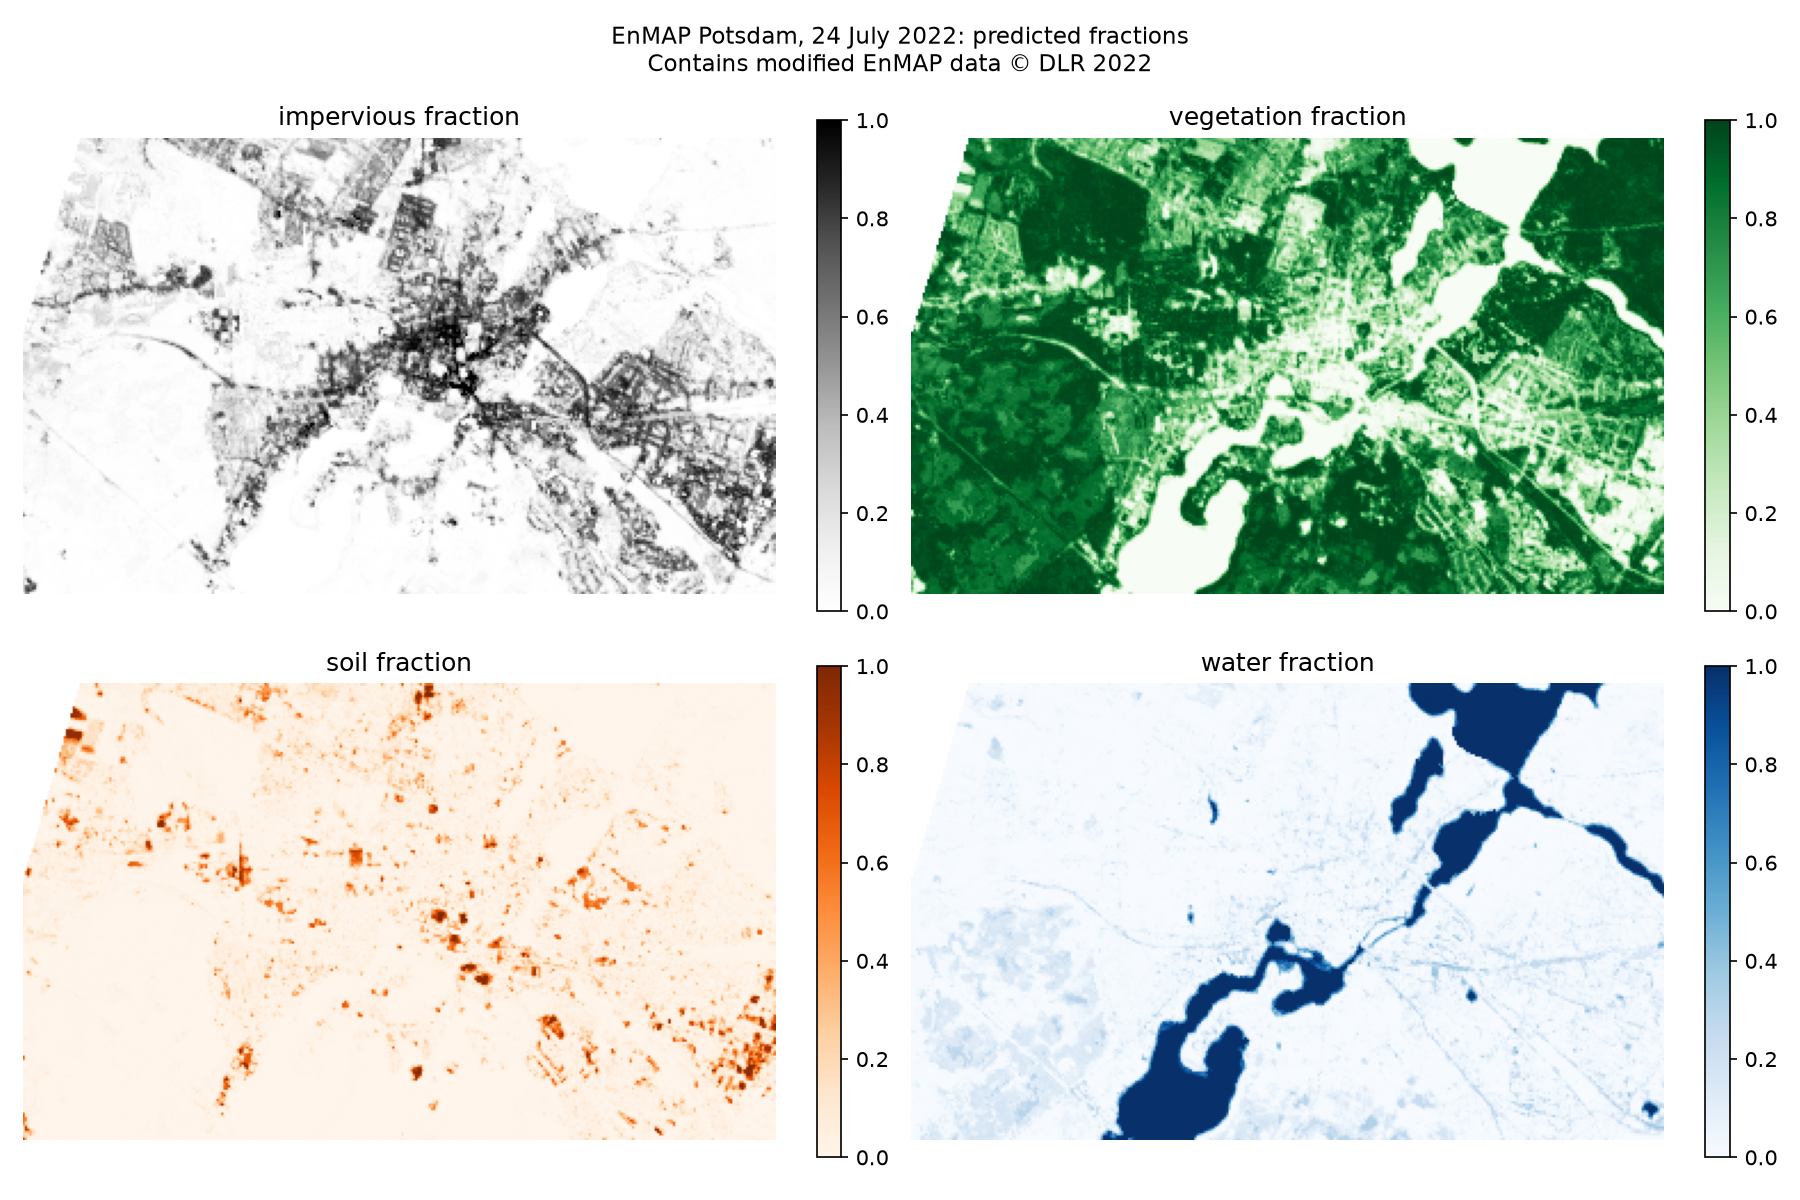
How much of each 30 m pixel is vegetation, sealed surface, soil or water? Regression-based unmixing of a real EnMAP hyperspectral scene of Potsdam, trained on synthetically mixed spectra with a Random Forest and validated against a 1 m aerial reference. After a band quality check, 185 of 224 bands were kept. Vegetation and sealed surfaces are mapped with a mean error of about 15 percentage points, water with 4.
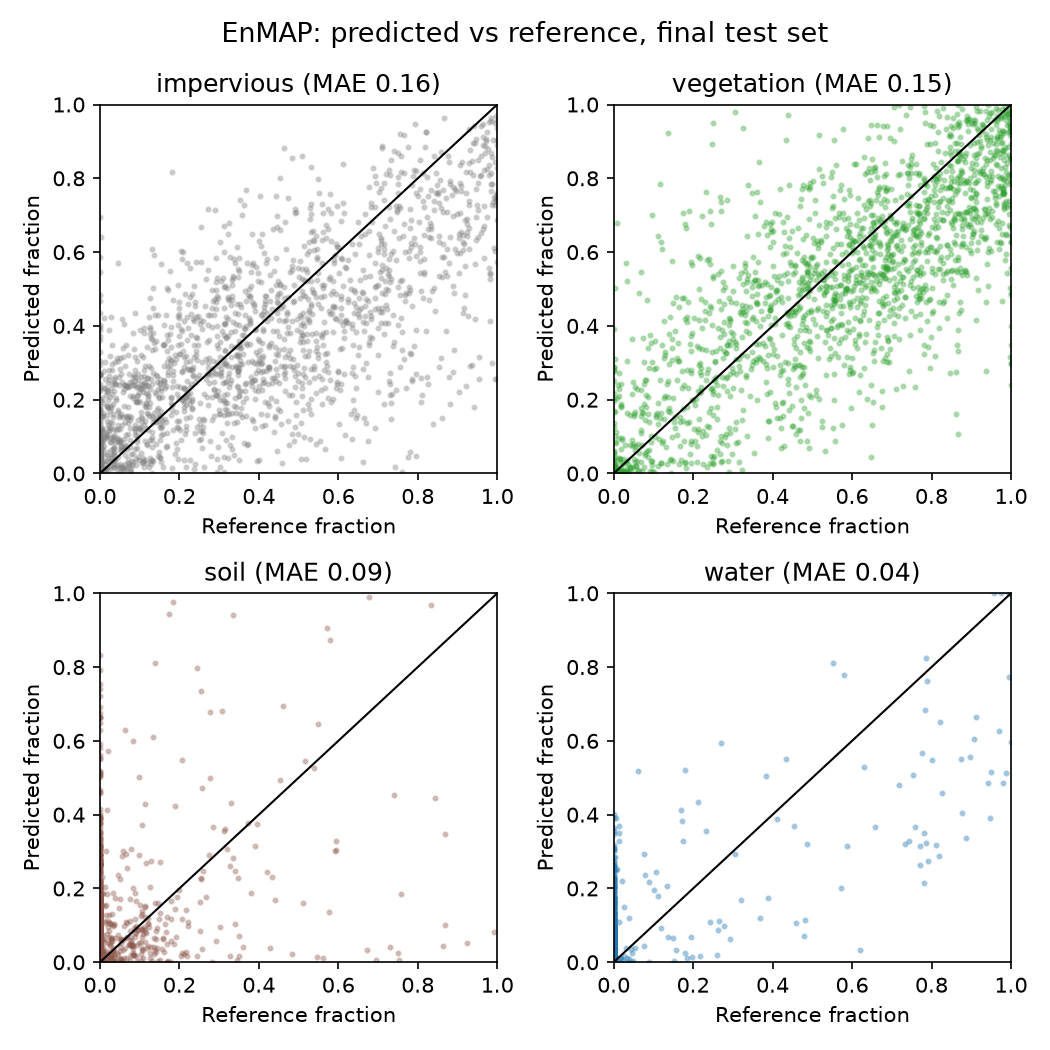
Is the hyperspectral sensor better? Trained on the same synthetic mixtures, simulated Sentinel-2 performs almost equally for these four broad classes. The reference date (2019 vs 2022), rare soil and shadows limit the accuracy more than the number of bands. The plot shows predicted against reference fractions for 1,806 test pixels.
How much of a municipality is covered by trees, and how tall is the forest? A Python workflow calculates canopy cover, mean forest height and upper canopy height for five Graubünden municipalities from the national forest inventory's canopy height model, and shows the results on an interactive map.
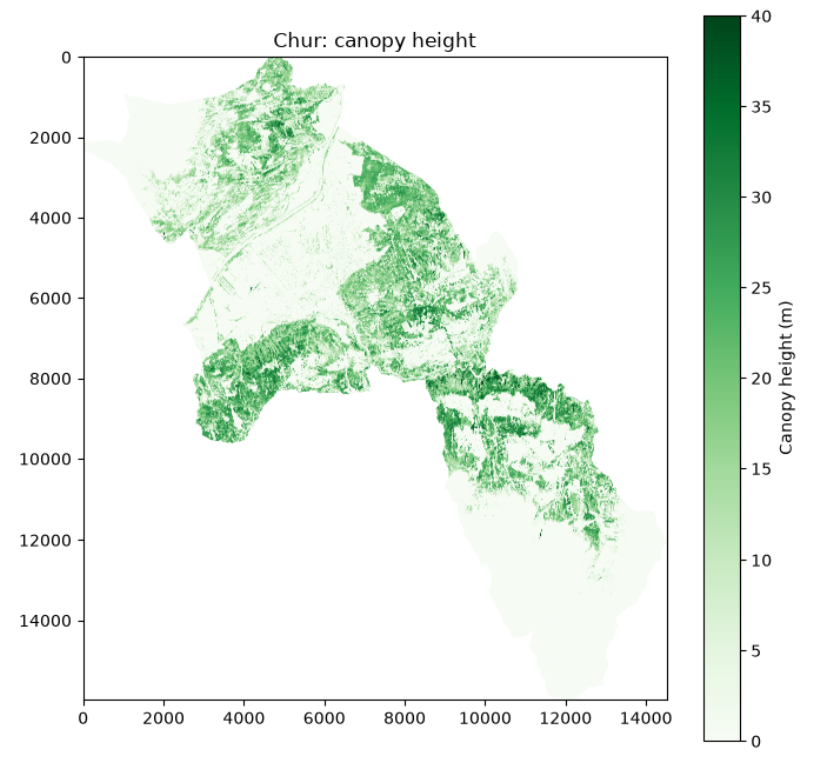
The 1 m canopy height model behind the analysis. Forests on the valley slopes reach 20 to 35 m, while the Rhine valley floor and the alpine area above the tree line stay near 0 m. This is why canopy cover is only 42 % in Chur.
When you search the federal environmental data portal umwelt.info for forest data in Brandenburg, do the results really lie in Brandenburg? A Python workflow downloads 200 search results from the umwelt.info API, draws the bounding box of each dataset and compares it with the state boundary. About two thirds lie in Brandenburg, one in four lies near it (mostly Berlin and map sheets on the border), and 13 lie somewhere else.
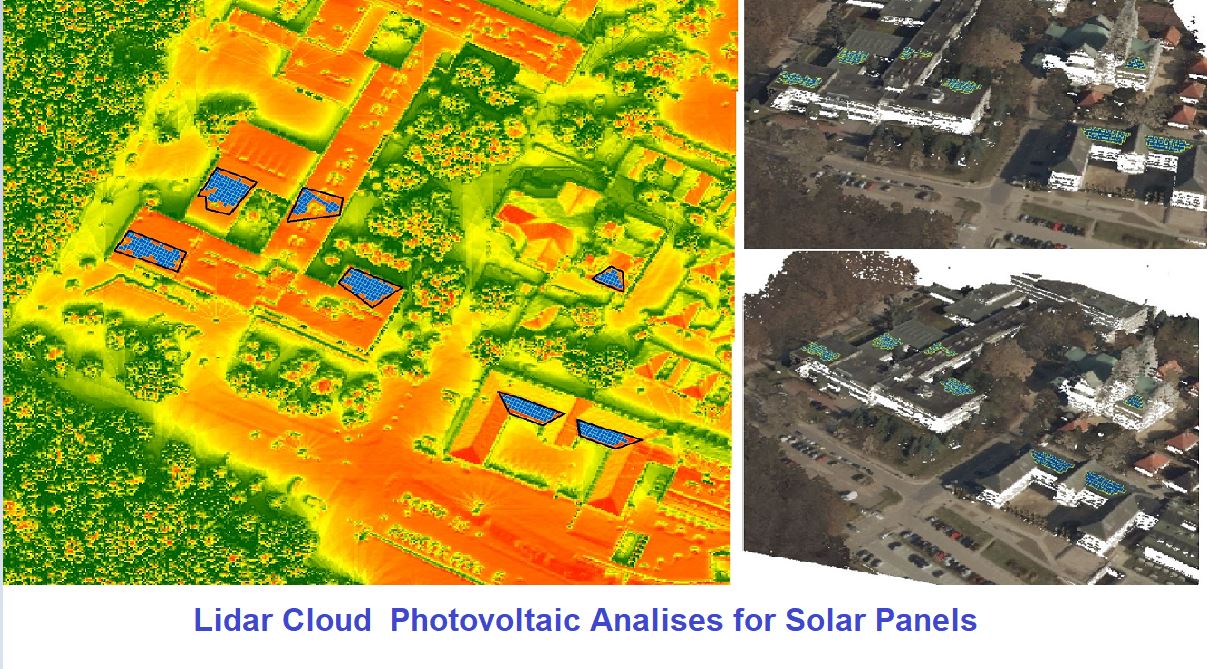
Using a LiDAR point cloud, sun exposure was simulated over 24 hours. The roofs that receive the most hours of light are the best candidates for installing solar panels.
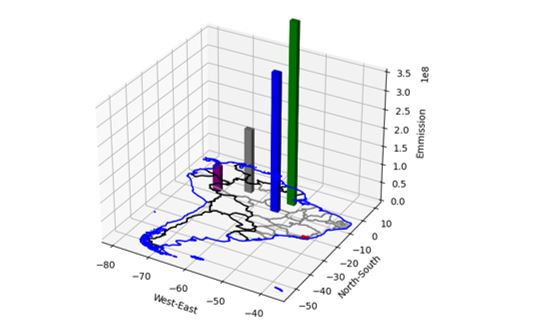
How much CO₂ did forest fires release in Brazil in 2018, and where? This map shows the emissions in the northern region, revealing where fires had the biggest climate impact.
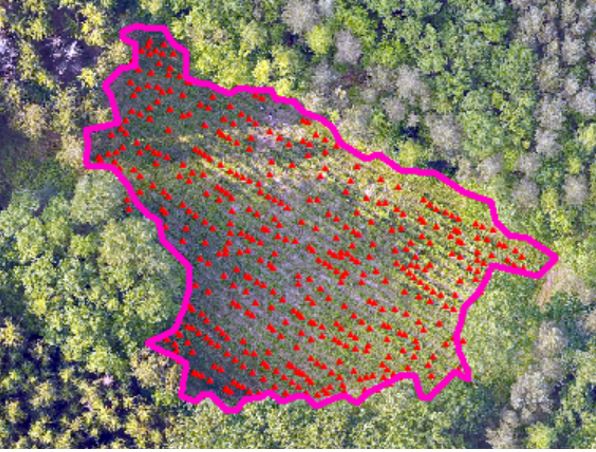
Photogrammetry from DJI Phantom 4 drone images of a forest regeneration area. The result supports counting the newly planted nursery trees.
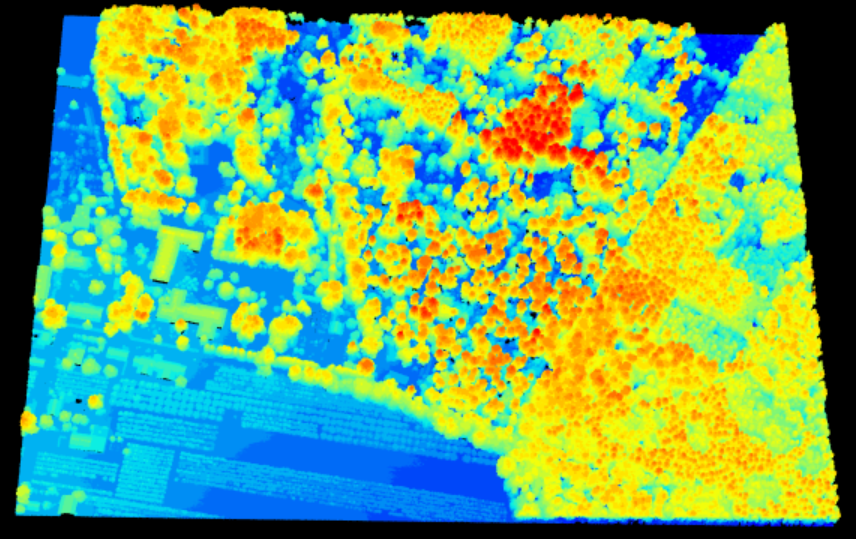
A LiDAR point cloud visualized in R to measure the distance between trees and nearby buildings in the city, supporting safety assessments of tree condition.
Or write directly: ellengomes@posteo.de. CV available on request.